NGCUSD
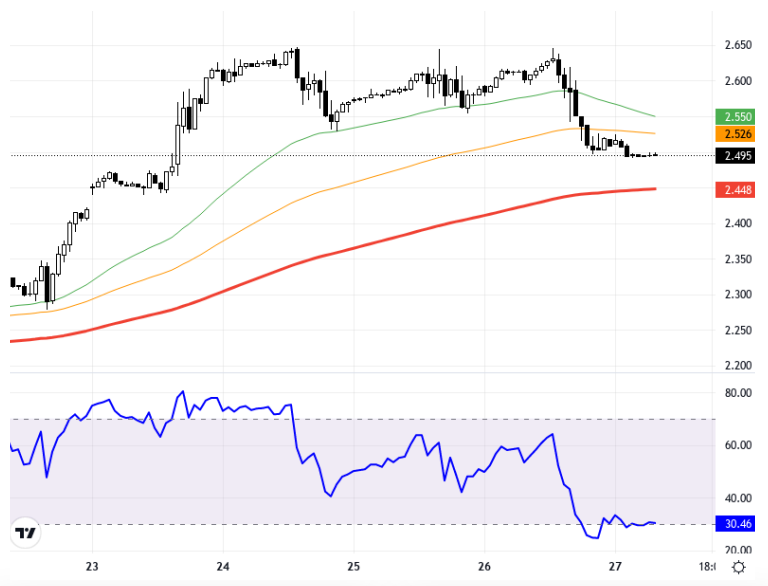
Natural gas futures have experienced profit-taking after maintaining gains following hurricane reports. Developments in European and US markets, as well as changes in the Fed's interest rate policy, could also influence pricing. In the current market conditions, remaining below the 2.740 – 2.780 resistance levels suggests that downward movements may continue. If the downward pressure persists, the levels of 2.675 and 2.650 could be targeted. However, in the event of a possible recovery, it's important for a strong upward movement to have closures above 2.780. From a technical analysis perspective, natural gas prices are being monitored on the 1-hour chart. If the price can stay above the 2.550 support level, it may signal an upward movement; however, it is currently close to the initial support zone at 2.448, with resistance at the 2.550 level. The RSI indicator is at 30.46, displaying a negative outlook. This indicates an oversold situation, hinting at a potential for recovery in the short term. The daily change shows a 0.04% decrease, with the current price at the 2.495 level. Support:2.675 - 2.65 - 2.61 - Resistance:2.74 - 2.78 - 2.82-
Doğal gaz vadeli işlemleri, kasırga haberleri sonrası elde edilen kazanımları koruduktan sonra kar satışlarına uğramış durumda. Avrupa ve ABD borsalarındaki gelişmelerin yanı sıra Fed'in faiz politikasındaki değişiklikler de fiyatlamalarda etkili olabilir. Şu anki piyasa koşullarında, fiyatın 2,740 – 2,780 direnç seviyeleri altında kalması, aşağı yönlü hareketlerin devam edebileceği anlamına geliyor. Aşağı yönlü baskının devam etmesi halinde 2,675 ve 2,650 seviyeleri hedeflenebilir. Ancak olası bir toparlanmada yukarı yönlü güçlü bir hareket için 2,780'in üzerinde kapanışların görülmesi önem arz ediyor. Teknik analiz açısından, doğal gaz fiyatları 1 saatlik grafikte izleniyor. Fiyat, 2,550 destek seviyesinin üzerinde kalabilirse yukarı yönlü bir hareketin sinyali olabilir, ancak şu anda 2,448 seviyesindeki ilk destek bölgesine yakın ve direnç 2,550 seviyesinde. RSI göstergesi 30,46 seviyesinde olup, negatif bir görünüm sergiliyor. Bu da aşırı satım bölgesine işaret ediyor ve kısa vadede bir toparlanma potansiyeli olabileceğine dair ipucu veriyor. Günlük değişim %0,04 düşüşle mevcut fiyat 2,495 seviyesinde bulunuyor. Destek:2.675 - 2.65 - 2.61 - Direnç:2.74 - 2.78 - 2.82-