GBPUSD
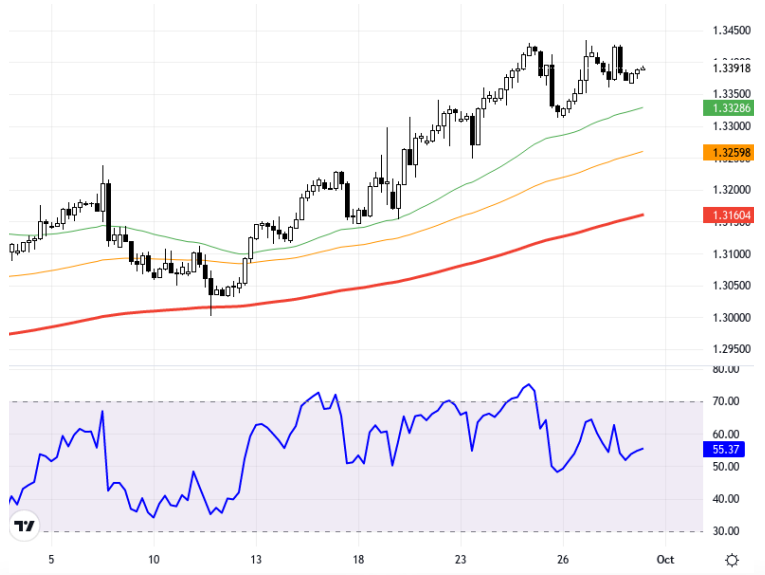
The GBP/USD pair continues to find direction amidst uncertainties about the general economic situation in the market and future economic policies of central banks. The upcoming meetings of the ECB, BoJ, Fed, and BoE in October and November could be decisive for the pair's movements. Critical data such as Germany's CPI, the UK growth figures, and key economic indicators from the US will also influence the trajectory of the GBP/USD pair. Moreover, speeches by Fed Chair Powell and ECB President Lagarde are among the factors that could have an instant impact on the pair in the coming days. From a technical analysis perspective, when the GBP/USD pair is evaluated on the 4-hour chart, it is trading above the 34-period moving average at the level of 1.3351. If the pair continues its upward movement, resistance levels at 1.3400, 1.3440, and 1.3475 can be monitored. In case of downward movements, levels of 1.3258 and 1.3160 appear as support. The RSI indicator is at 55.29, displaying a neutral outlook. The pair shows a minimal change of 0.02% compared to the previous day, trading at the 1.3387 level. Support:1.3351 - 1.331 - 1.3265 - Resistance:1.34 - 1.344 - 1.3475 -
GBP/USD paritesi, piyasadaki genel ekonomik durum ve merkez bankalarının gelecekteki ekonomik politikalarına dair belirsizliklerle yön bulmaya devam ediyor. Özellikle Ekim ve Kasım aylarında gerçekleştirilecek olan ECB, BoJ, Fed ve BoE toplantıları, paritenin hareketlerinde belirleyici olabilir. Almanya TÜFE, İngiltere büyüme verisi ve ABD'den gelecek önemli ekonomik göstergeler de GBP/USD paritesinin seyrini etkileyecek kritik veriler arasında. Ayrıca Fed Başkanı Powell ve ECB Başkanı Lagarde'ın konuşmaları, önümüzdeki günlerde parite üzerinde anlık etki yapabilecek unsurlar arasında yer alıyor. Teknik analiz açısından GBP/USD paritesi 4 saatlik grafikte değerlendirildiğinde, 1.3351 seviyesindeki 34 periyotluk ortalama üzerinde seyrediyor. Paritenin yükselişini sürdürmesi durumunda 1.3400, 1.3440 ve 1.3475 direnç seviyeleri izlenebilir. Aşağı yönlü hareketlerde ise 1.3258 ve 1.3160 seviyeleri destek olarak karşımıza çıkıyor. RSI göstergesi 55.29 seviyesinde olup nötr bir görünüm sergiliyor. Parite önceki güne göre %0.02 oranında minimal bir değişim göstererek 1.3387 seviyesinden işlem görüyor. Destek:1.3351 - 1.331 - 1.3265 - Direnç:1.34 - 1.344 - 1.3475 -