WTIUSD
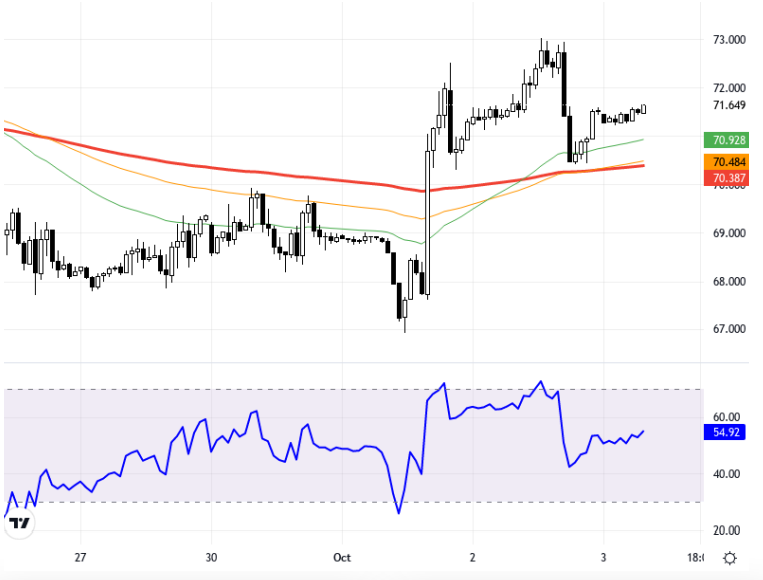
As oil markets show recovery due to ongoing high tensions in the Middle East, the trends of European and US stock exchanges are being closely monitored. Losses in China due to stimulus measures and OPEC's announcements of no changes in production quotas are also increasing volatility in the oil market. Strong employment data from the US and the strengthening of the dollar may continue to pose a barrier to the recovery of oil prices. The chart analyzes WTI oil prices in a 1-hour time frame. As prices move between the levels of 70.28 and 71.50, the range of 69.50 – 70.00 maintains its importance as a support zone. In upward movements, the levels of 71.50 and 72.00 may form resistance. The RSI indicator is at 54.85 and shows a positive outlook. The chart indicates a 0.22% increase compared to the previous close. The current price is seen as 71.644. Support:70.5 - 70 - 69.5 - Resistance:71.5 - 72 - 72.5 -
Petrol piyasaları, Orta Doğu'da devam eden yüksek gerilim nedeniyle toparlanma gösterirken, Avrupa ve ABD borsalarının seyri yakından izleniyor. Çin'de teşvik adımlarının etkisiyle yaşanan kayıplar ve OPEC'in üretim kotasında değişiklik yapmayacağı açıklamaları da petrol piyasasında volatiliteyi artırıyor. ABD'den gelen güçlü istihdam verileri ve doların güçlenmesi ise petrol fiyatlarındaki toparlanmanın önünde engel oluşturmaya devam edebilir. Grafikte WTI petrol fiyatı 1 saatlik zaman diliminde inceleniyor. Fiyat, 70.28 ve 71.50 seviyeleri arasında hareket ederken, 69.50 – 70.00 bandı destek bölgesi olarak önemini koruyor. Yukarı yönlü hareketlerde 71.50 ve 72.00 seviyeleri direnç oluşturabilir. RSI göstergesi 54.85 seviyesinde ve pozitif bir görünüm sergiliyor. Grafik, önceki kapanışa göre %0.22 artış göstermekte. Güncel fiyat 71.644 olarak görülüyor. Destek:70.5 - 70 - 69.5 - Direnç:71.5 - 72 - 72.5 -