NGCUSD
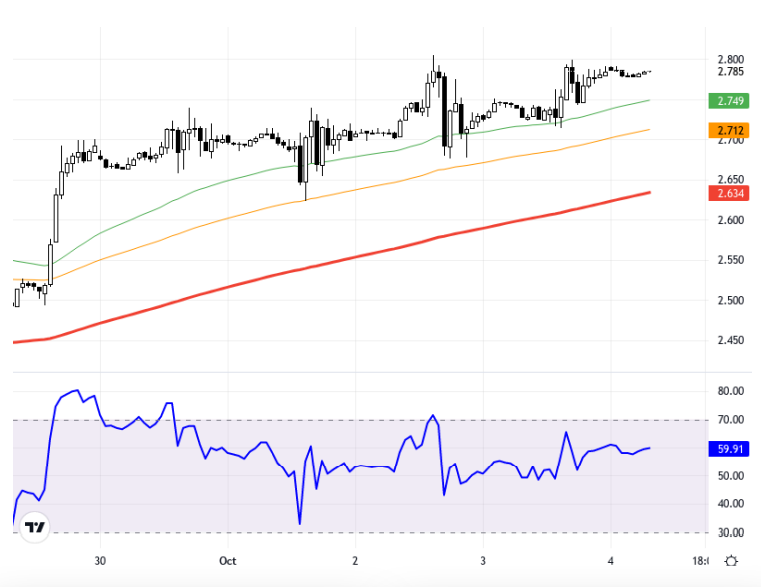
US natural gas futures are experiencing price gains due to a lower-thanexpected increase in stocks and forecasts of strong future demand. Natural gas prices, which followed a calmer trend during the Asian session, may also track the direction of European and US markets throughout the day. As long as the pricing stays above the 2.880 – 2.910 support levels, an upward outlook can be maintained. In case the upward movement continues, the 3.000 and 3.040 levels can be targeted. In a potential downturn scenario, closings below 2.880 might indicate the continuation of the downtrend, in which case the 2.850 and 2.820 levels might come into focus. In the hourly chart view of natural gas prices, it is observed that trading is around the 2.785 level. Short-term resistance levels are observed as 2.786 and 2.800, while 2.749, 2.712, and 2.664 levels can be monitored as support. The RSI indicator is at the 59.91 level, showing a slightly positive outlook. A calm movement is being observed with a small decrease of 0.001% compared to the previous day. The current price is at the 2.785 level. Support:2.91 - 2.88 - 2.85 - Resistance:3 - 3.04 - 3.07 -
ABD doğal gaz vadeli işlemleri, stoklarda beklenenin altında bir artış ve gelecekteki güçlü talep beklentileri nedeniyle fiyat kazançları yaşıyor. Asya seansında daha sakin bir seyir izleyen doğal gaz fiyatları, gün içinde Avrupa ve ABD borsalarının yönünü de takip edebilir. Fiyatlamalar 2,880 – 2,910 destek seviyeleri üzerinde kaldığı sürece, yukarı yönlü bir görünüm korunabilir. Yükselişlerin devamı durumunda 3,000 ve 3,040 seviyeleri hedeflenebilir. Olası düşüş senaryosunda ise, 2,880 altındaki kapanışlar, düşüş trendinin devamı için bir işaret olabilir ve bu durumda 2,850 ve 2,820 seviyeleri gündeme gelebilir. Doğal gaz fiyatlarının saatlik grafik görünümünde, mevcut seviyelerde 2,785 civarında işlem gördüğü görülüyor. Kısa vadeli direnç seviyeleri 2,786 ve 2,800 olarak gözlemlenirken; 2,749, 2,712 ve 2,664 seviyeleri destek olarak izlenebilir. RSI göstergesi 59,91 seviyesinde olup, hafif pozitif bir görünüm sergiliyor. Önceki güne göre %0,001'lik küçük bir gerileme ile sakin bir hareket izleniyor. Güncel fiyat, an itibarıyla 2,785 seviyesinde bulunuyor. Destek:2.91 - 2.88 - 2.85 - Direnç:3 - 3.04 - 3.07 -