NGCUSD
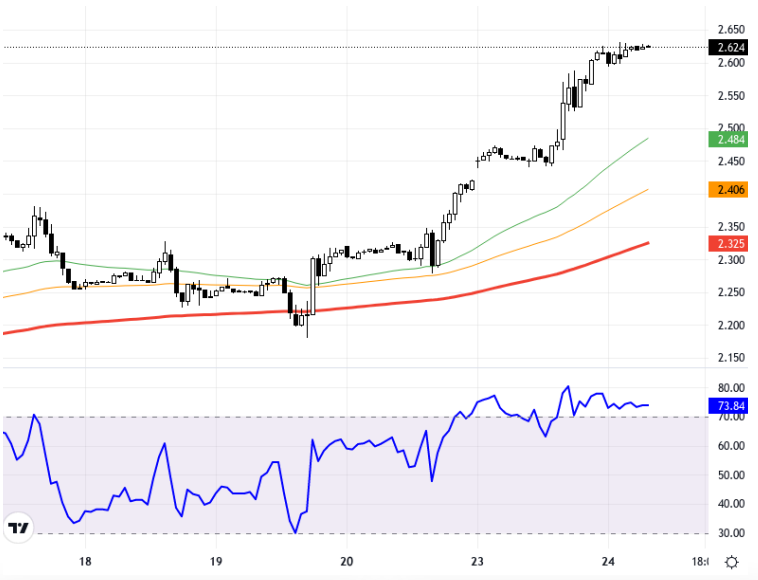
U.S. natural gas prices continue to rise with forecasts predicting potential disruptions in production in the Gulf of Mexico. This development could be closely linked with movements in the European and U.S. stock markets. As long as prices remain above the 2.780 – 2.820 support levels, the upward outlook may be valid, targeting levels of 2.910 and 2.940. However, if prices fall below the 2.780 level, a pullback toward the 2.740 and 2.710 levels may occur. Technically, NGCUSD is examined on the hourly chart. The pair is trading above the EMA 50 level of 2.484, and the RSI indicator is at 73.84, indicating overbought conditions, presenting a positive outlook. Compared to the previous day's closing, the price change has occurred in a positive direction. The current price is at 2.624, and the upward momentum may seem to continue. Support:2.85 - 2.82 - 2.78 - Resistance:2.88 - 2.91 - 2.94
ABD doğal gaz fiyatları, Meksika Körfezi'nde üretimin yeniden etkilenebileceğine dair tahminlerle birlikte yükselişini sürdürüyor. Bu gelişme, özellikle Avrupa ve ABD borsalarındaki hareketlerle de yakından ilişkili olabilir. Fiyatlar 2,780 – 2,820 destek seviyelerinin üzerinde kaldığı sürece yukarı yönlü görünüm geçerli olabilir ve 2,910 ile 2,940 seviyeleri hedeflenebilir. Ancak, fiyatların 2,780 seviyesinin altına düşmesi durumunda 2,740 ve 2,710 seviyelerine doğru bir geri çekilme yaşanabilir. Teknik açıdan, NGCUSD saatlik grafikte inceleniyor. Parite, 2,484 olan EMA 50 seviyesi üzerinde seyrediyor ve RSI göstergesi 73,84 ile aşırı alım bölgesine işaret ederek pozitif bir görünüm sergiliyor. Önceki günkü kapanışa göre fiyat değişimi pozitif yönde gerçekleşmiş. Mevcut fiyat 2,624 seviyesinde olup, yukarı yönlü ivme devam edebilir gibi görünüyor. Destek:2.85 - 2.82 - 2.78 - Direnç:2.88 - 2.91 - 2.94 -