USDTRY
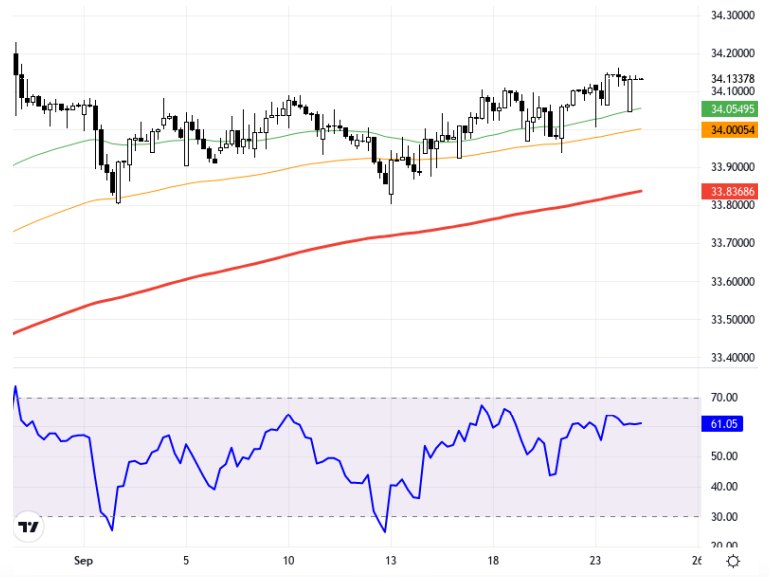
The USD/TRY pair is attracting attention with the movements of developing countries' currencies against the US Dollar. Recently, while the Malaysian Ringgit has gained strength against the dollar, the Turkish Lira and the Peruvian Sol continue to display weak trends. The relatively weak performance of the Turkish Lira is shaped by developments in global markets. The Chinese Central Bank's stimulus decisions have positively affected Asian indices. At the same time, statements from FED officials concerning tightening policies are decisive for the direction of the dollar. In light of these developments, the USD/TRY is trading close to the 34.15 level. When examining the USD/TRY rate on a 4-hour time frame on the chart, it can be noted that the 33.96 level is an important support point. As long as the rate remains above this level, it may move towards resistance zones at 34.21, 34.30, and 34.37. The upper point of the Envelope indicator is at 34.30, and if it surpasses this level, an increase up to 34.64 and 34.70 levels can be observed. The RSI indicator is at 61.05, indicating a positive trend. There is a 0.02% change in the rate compared to the previous day. The current price is at the 34.13 level. Support:34.03 - 33.96 - 33.91 - Resistance:34.21 - 34.3 - 34.37 -
USD/TRY paritesi, gelişmekte olan ülkelerin para birimlerinin ABD Doları karşısındaki hareketleriyle dikkat çekiyor. Son dönemde Malezya Ringgiti dolar karşısında güç kazanırken, Türk Lirası ve Peru Solu zayıf seyrini sürdürüyor. Türk Lirası'nın nispeten zayıf performansı, küresel piyasalardaki gelişmelere bağlı olarak şekilleniyor. Çin Merkez Bankası'nın teşvik kararları Asya endekslerine olumlu yansıdı. Aynı zamanda, FED yetkililerinin sıkım politikalarıyla ilgilenen açıklamaları, doların yönü üzerinde belirleyici oluyor. Bu gelişmeler ışığında USD/TRY 34,15 seviyesine yakın bir seyir izliyor. Grafikte USD/TRY kuru 4 saatlik zaman diliminde incelendiğinde, 33,96 seviyesinin önemli bir destek noktası olduğuna dikkat çekilebilir. Kur bu seviye üzerinde kaldıkça 34,21, 34,30 ve 34,37 direnç bölgelerine doğru hareket edebilir. Envelope göstergesinin üst noktası 34,30 seviyesinde, bu seviyenin üzerine çıkılması durumunda ise 34,64 ve 34,70 seviyelerine kadar yükseliş gözlenebilir. RSI göstergesi 61,05 seviyesinde olup pozitif bir eğilime işaret ediyor. Kurun önceki güne göre hareketinde yüzde 0,02'lik bir değişim gözleniyor. Güncel fiyat 34,13 seviyesinde bulunmaktadır. Destek:34.03 - 33.96 - 33.91 - Direnç:34.21 - 34.3 - 34.37 -