NGCUSD
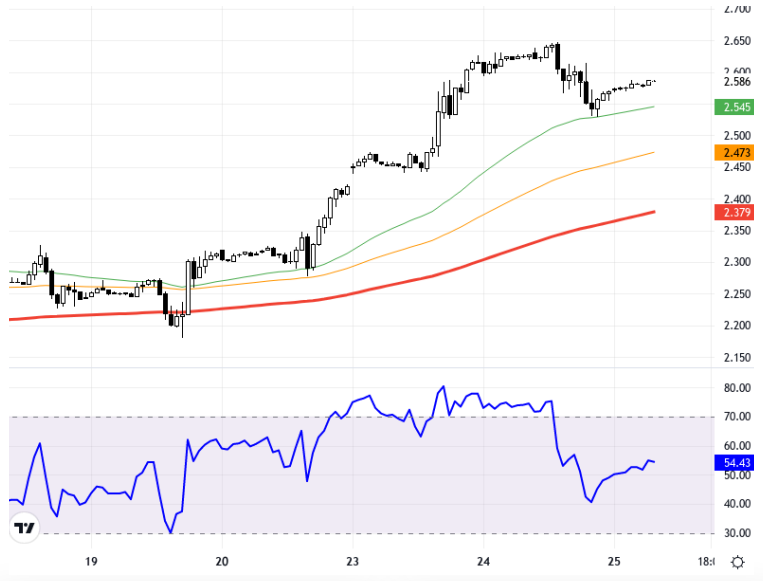
U.S. natural gas futures showed a limited recovery attempt during the Asian session following profit-taking sales. The stimulus measures announced by China provided support to commodity markets and emerging market currencies. However, U.S. 10-year bond yields and the weak dollar index stand out as other important factors that could affect natural gas prices. The trajectory of European and U.S. stock markets should be considered as potentially decisive in pricing. In technical analysis, when the NGCUSD pair is examined on the 1-hour chart, the levels of 2.740 and 2.780 stand out as support. In upward movements, the resistance levels of 2.850 and 2.880 can be monitored. The RSI indicator is at the level of 54, displaying a neutral outlook. A change of 0.04% compared to the previous day is observed. The current trading price is at the level of 2.586. Support:2.78 - 2.74 - 2.71 Resistance:2.85 - 2.88 - 2.91 -
ABD doğal gaz vadeli işlemleri, kar satışlarının ardından Asya seansında sınırlı bir toparlanma çabası gösterdi. Çin tarafından açıklanan teşvik önlemleri, emtia piyasalarına ve gelişen ülke para birimlerine destek sağladı. Bununla birlikte, ABD 10 yıllık tahvil faizleri ve zayıf dolar endeksi, doğal gaz fiyatlarını etkileyebilecek diğer önemli unsurlar olarak öne çıkıyor. Avrupa ve ABD borsalarının seyrinin, fiyatlama üzerinde belirleyici olabileceği göz önünde bulundurulmalı. Teknik analizde, NGCUSD paritesi 1 saatlik grafikte incelendiğinde 2.740 ve 2.780 seviyeleri destek olarak göze çarpıyor. Yukarı yönlü hareketlerde ise 2.850 ve 2.880 direnç seviyeleri izlenebilir. RSI göstergesi 54 seviyesinde olup nötr bir görünüm sergiliyor. Önceki güne göre yüzde 0.04 oranında bir değişim gözleniyor. Güncel işlem fiyatı ise 2.586 seviyesinde bulunuyor. Destek:2.78 - 2.74 - 2.71 - Direnç:2.85 - 2.88 - 2.91


