XAUUSD
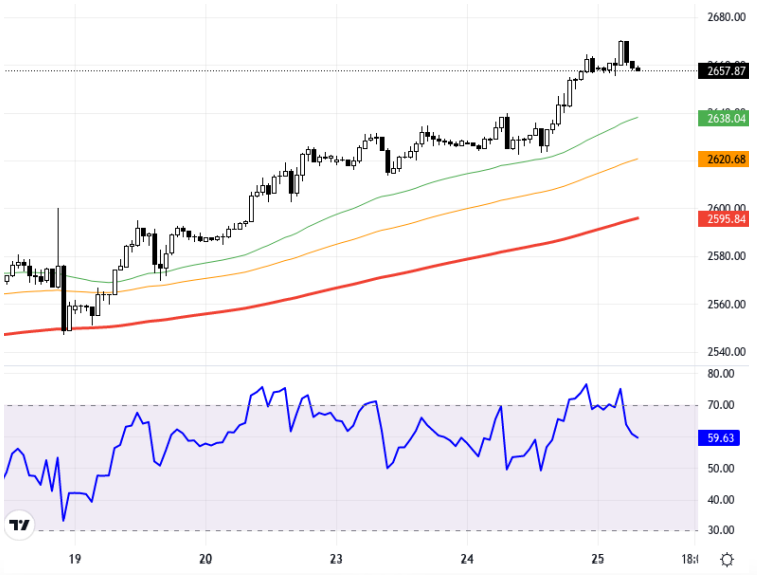
The unexpected drop in the Conference Board consumer confidence index weakened the dollar index. Additionally, increasing geopolitical risks in the Middle East have led to a rise in safe-haven demand, causing an increase in the value of spot gold. This situation also allows the precious metal to trade above levels supported by short-term indicators. Meanwhile, stimulus measures and interest rate cuts in China are creating a positive perception in global markets, while the weak consumer confidence index in the U.S. is heightening speculation over the Fed's interest rate decision. Technically, the chart is analyzed on a 1-hour timeframe. As long as movement continues above the 2630-2640 area, the upward trend may persist; in this case, the 2670 and 2680 resistance levels can be targeted. Breaking the 2670 resistance could be critically important for maintaining a positive outlook. On downward movements, closures below the 2630-2640 support area could lead to retracements to the 2620 and 2610 levels. The RSI indicator is at 59, showing a positive trend. The current price is 2657.87, showing a slight decrease compared to the previous day. Support:2650 - 2640 - 2630 Resistance:2670 - 2680 - 2690
Conference Board tüketici güven endeksinin beklenenden fazla düşmesi dolar endeksini zayıflattı. Bunun yanında Orta Doğu'da artan jeopolitik riskler güvenli liman talebini artırarak ons altının değer kazanmasına yol açtı. Ayrıca bu durum, kıymetli metalin kısa vadede izlenen göstergelerin desteklediği seviyeler üzerinde işlem görmesine olanak tanıyor. Çin'deki teşvik önlemleri ve faiz indirimleri de global piyasalarda olumlu algı oluştururken, ABD'deki zayıf tüketici güven endeksi Fed'in faiz kararı üzerindeki spekülasyonları artırıyor. Teknik olarak, grafik 1 saatlik zaman diliminde incelenmektedir. 2630-2640 bölgesi üzerinde hareketlilik sürdüğü sürece yukarı yönlü ilerleyiş devam edebilir; bu durumda 2670 ve 2680 direnç seviyeleri hedeflenebilir. 2670 direncinin kırılması, pozitif görünümün sürdürülmesi açısından kritik önemde olabilir. Aşağı yönlü hareketlerde ise 2630-2640 destek bölgesinin altındaki kapanışlar 2620 ve 2610 seviyelerine geri çekilmeleri beraberinde getirebilir. RSI göstergesi 59 seviyesinde olup, pozitif bir eğilim göstermektedir. Güncel fiyat 2657.87 seviyesindedir ve önceki güne kıyasla hafif bir düşüş göstermektedir. Destek:2650 - 2640 - 2630 Direnç:2670 - 2680 - 2690