WTIUSD
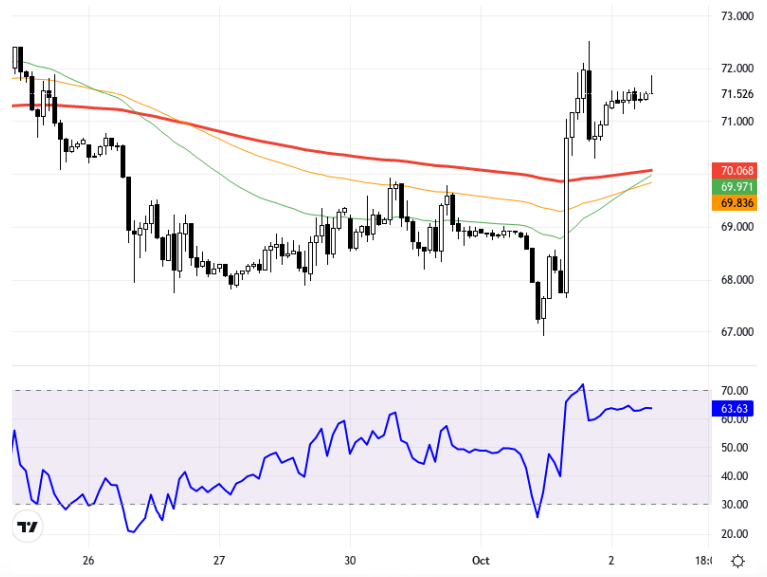
Geopolitical tensions in the Middle East, especially the conflicts between Iran and Israel, are causing fluctuations in oil prices. Events such as Israel's ground operation in Lebanon and Iran's ballistic missile attack on Israel have created an upward trend in the oil market. Additionally, the American Petroleum Institute's announcement of a decrease in stocks has also supported this rise. However, investors are also paying attention to the stock figures that will be announced by the U.S. Energy Information Administration. In the upcoming period, pricing above the 69.50-70.00 support levels can contribute to the continuation of the upward potential. On the chart, when WTI Crude Oil is examined on an hourly timeframe, it is trading above the 69.50 support level. Increases can be followed with resistance levels of 71.50 and 72.00. The RSI indicator is at 63.75, showing a positive outlook. Compared to the previous day, a minor change of 0.13% is observed. The current price is at 71.52, and technical indicators suggest that the upward trend may continue. Support:70.5 - 70 - 69.5 - Resistance:71.5 - 72 - 72.5 -
Orta Doğu'da yaşanan jeopolitik gerilimler, özellikle İran ve İsrail arasındaki çatışmalar, petrol fiyatlarında dalgalanmalara neden oluyor. İsrail’in Lübnan’a yönelik kara harekatı ve İran’ın İsrail’e balistik füze saldırısı gibi olaylar, petrol piyasasında yükseliş eğilimi yarattı. Ayrıca Amerikan Petrol Enstitüsü’nün stoklarda düşüş açıklaması da bu yükselişi desteklemiş durumda. Ancak, yatırımcılar ABD Enerji Bilgi Dairesi’nin açıklayacağı stok rakamlarına da dikkat ediyor. Önümüzdeki süreçte 69,50-70,00 destek seviyelerinin üzerindeki fiyatlamalar, yükseliş yönlü potansiyelin sürmesine katkıda bulunabilir. Grafikte ise WTI Crude Oil, 1 saatlik zaman diliminde incelendiğinde, 69,50 destek seviyesi üzerinde işlem görüyor. Yükselişlerde 71,50 ve 72,00 seviyeleri direnç olarak izlenebilir. RSI göstergesi 63,75 seviyesinde, pozitif bir görünüm sergiliyor. Önceki güne göre ise %0,13'lük küçük bir değişim gözlemleniyor. Güncel fiyat ise 71,52 seviyesinde bulunuyor ve teknik göstergeler yukarı yönlü eğilimin devam edebileceğini işaret ediyor. Destek:70.5 - 70 - 69.5 - Direnç:71.5 - 72 - 72.5 -