EURUSD
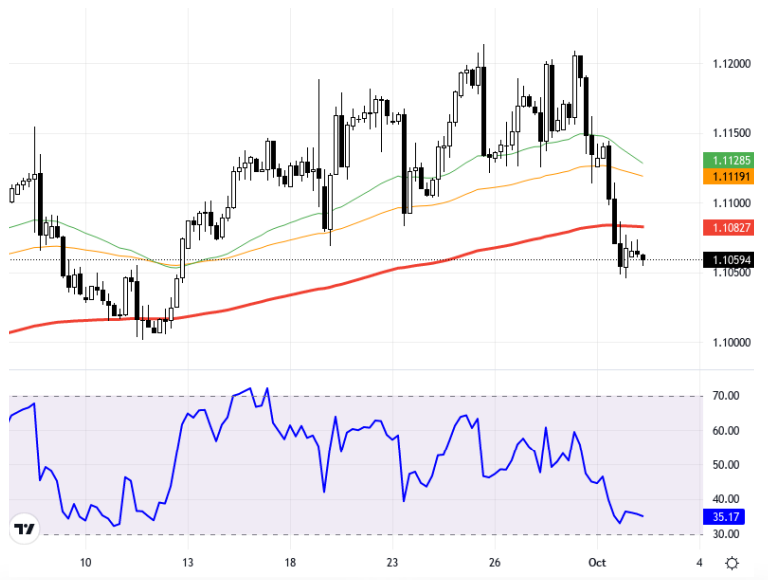
The decline observed in the CPI data from Germany and the Eurozone, along with negative PMI data, has increased expectations for a rate cut by the ECB. On the U.S. side, the contraction in ISM Manufacturing PMI data and the JOLTS data exceeding expectations make it important to monitor economic data, while geopolitical risks continue to guide the markets. In this context, the short-term negative trend of the Dollar Index is considered significant for the continuation of upward movements in the EURUSD and GBPUSD pairs. The EURUSD pair is trying to stay above the 233-period average with its current downward trend. In technical analysis, the EURUSD pair is being examined on a 4-hour chart. The pair is currently at the 1.1060 level, with the 1.1082 level acting as resistance and the 1.1050 level as a support region. The RSI indicator is at 35.21 and shows a negative outlook. There is a 0.33% decrease compared to the previous day. In light of this information, it is important to monitor the price movements in the pair in accordance with the possible support and resistance regions. Support:1.104 - 1.099 - 1.094 - Resistance:1.11 - 1.115 - 1.12 -
Almanya ve Euro Bölgesi'nde TÜFE verilerinde gözlenen gerileme ve olumsuz PMI verileri, ECB'nin faiz indirimi beklentisini artırdı. ABD tarafında ise ISM İmalat PMI verisinin daralması ve JOLTS verisinin beklenti üzerinde gelmesi, ekonomik verilerin izlenmesini önemli kılarken, jeopolitik riskler ise piyasalara yön vermeye devam ediyor. Bu bağlamda Dolar Endeksi'nin kısa vadede negatif seyri, EURUSD ve GBPUSD paritelerindeki yükselişlerin devamı için önemli bulunuyor. EURUSD paritesi, mevcut düşüş eğilimi ile 233 periyotluk ortalamanın üzerinde kalmaya çalışıyor. Teknik analizde, EURUSD paritesi 4 saatlik grafikte inceleniyor. Parite şu anda 1.1060 seviyesinde olup, 1.1082 seviyesi direnç, 1.1050 seviyesi ise destek bölgesi olarak izleniyor. RSI göstergesi 35.21 seviyesinde ve negatif bir görünüm sergiliyor. Bir önceki güne göre %0.33 oranında bir düşüş söz konusu. Bu bilgiler ışığında, paritedeki fiyat hareketlerinin olası destek ve direnç bölgeleri doğrultusunda izlenmesi önemlidir. Destek:1.104 - 1.099 - 1.094 Direnç:1.11 - 1.115 - 1.12 -