NDXUSD
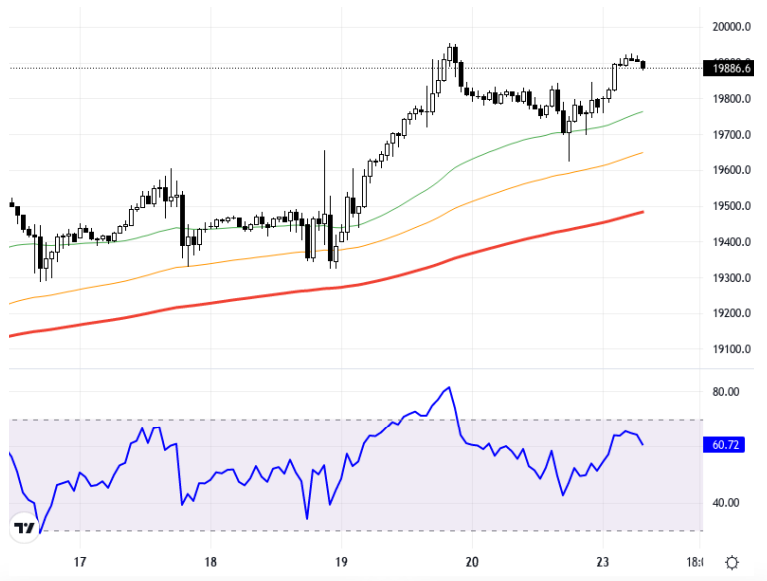
The NASDAQ100 index is drawing investors' attention ahead of the expected PMI data in the USA. As developments following the Fed's interest rate cut affect the markets, the expectation of expansionary measures for the Chinese economy is seen to have a positive reflection on Asian markets. Despite geopolitical tensions in the Middle East, it is emphasized that US index futures have started the week positively. In this context, the NASDAQ100 index is displaying a strong upward trend, particularly despite the recovery in the 10-year bond yield. Technically, the NASDAQ100 index is trading above the 19900 – 20000 support zone on the hourly chart. As long as it remains above this area, the upward trend could potentially target resistance levels of 20250 and 20350. The RSI indicator is at 60.71, showing a positive outlook. The current price of the index, which experienced a 0.09% drop compared to the previous day, is at 19886. In light of this data, it is notable that monitoring the index's support and resistance levels remains necessary. Support:20000 - 19900 - 19800- Resistance:20250 - 20350 -20500 -
NASDAQ100 endeksi, ABD'de beklenen PMI verileri öncesinde yatırımcıların dikkatini çekiyor. Fed'in faiz indirimi sonrasındaki gelişmeler piyasaları etkilerken, Çin ekonomisine yönelik genişleyici önlemler beklentisinin Asya piyasalarına olumlu yansıdığı görülüyor. Orta Doğu’daki jeopolitik gerginliklere rağmen, ABD endeks vadelilerinin haftaya pozitif başladığı vurgulanıyor. Bu çerçevede, NASDAQ100 endeksi, özellikle 10 yıllık tahvil faizindeki toparlanmaya rağmen sert bir yükseliş trendi sergiliyor. Teknik olarak, NASDAQ100 endeksi saatlik grafikte 19900 – 20000 destek bölgesinin üzerinde işlem görüyor. Bu bölgenin üzerinde kalındığı sürece yükseliş eğilimi potansiyel olarak 20250 ve 20350 direnç seviyelerini hedefleyebilir. RSI göstergesi 60.71 seviyesinde, pozitif bir görünüm sergiliyor. Bir önceki güne göre %0.09'luk bir düşüş yaşamış olan endeksin güncel fiyatı 19886'da bulunuyor. Bu veriler ışığında, endeksin destek ve direnç seviyelerinin izlenmeye devam edilmesi gerekliliği dikkat çekiyor. Destek:20000 - 19900 - 19800 - Direnç:20250 - 20350 - 20500 -