GBPUSD
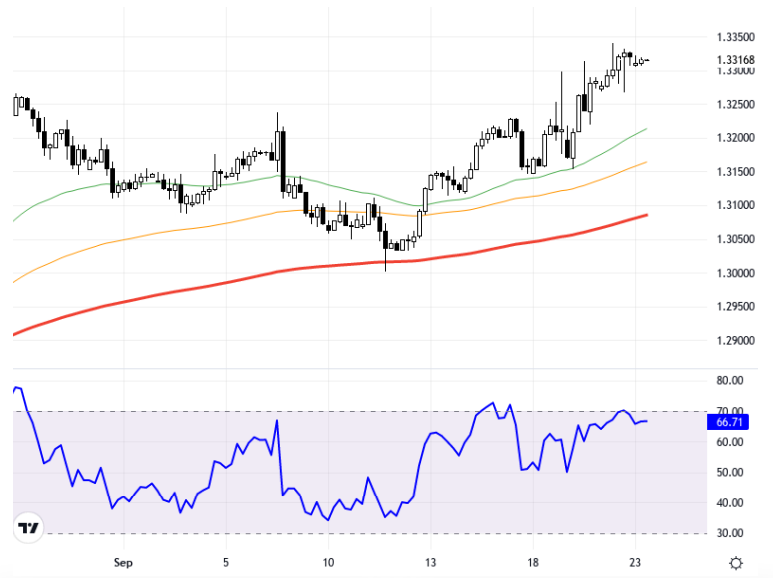
This week, the focus of global markets on the GBPUSD pair will be on the economic data coming from the US and the Eurozone, as well as statements from central bank officials. Particularly, the growth and PCE inflation data from the US could be decisive for the dollar. Moreover, statements from Fed officials may lead to a search for new directions in the markets. The Classic Dollar Index remaining below the 102.00 – 101.48 range indicates that the negative pressure on the dollar persists. This situation could support the upward movement of the GBPUSD pair. Especially, the 55 and 89-period averages in the 1.3180 – 1.3220 range remain significant. From a technical analysis perspective, on the 4-hour chart, it is observed that the pair is testing the 1.3320 resistance, which is crucial to determine whether this level will result in reactive selling or a trend rally. The 1.3360 and 1.3400 barriers should also be monitored for upward movements. In case of a downward movement, the 1.3180 level acts as a support. The RSI indicator is at 66.71, presenting a positive outlook. The pair is trading at the 1.3317 level with a 0.00% change during the day. In light of these data, the short-term positive trend in the GBPUSD pair may continue. Support:1.3265 - 1.322 - 1.318 - Resistance:1.332 - 1.336 - 1.34 -
GBPUSD paritesi, bu hafta küresel piyasaların gözü, ABD ve Euro Bölgesi'nden gelecek ekonomik veriler ve merkez bankası yetkililerinin açıklamalarında olacak. Özellikle ABD'den gelecek büyüme ve PCE enflasyon verileri dolar üzerinde belirleyici olabilir. Ayrıca, Fed yetkililerinin yapacakları açıklamalar piyasalarda yeni yön arayışlarına sebep olabilir. Klasik Dolar Endeksi’nin 102,00 – 101,48 bölgesi altında seyretmesi, dolardaki negatif baskının sürdüğüne işaret ediyor. Bu durum, GBPUSD paritesinin yukarı yönlü hareketini destekleyici nitelikte olabilir. Özellikle 1,3180 – 1,3220 bölgesindeki 55 ve 89 periyotluk ortalamalar önemini koruyor. Teknik analiz açısından 4 saatlik grafikte, paritenin 1,3320 direncini test ettiği gözlemleniyor ve bu seviye tepkisel satışlar mı yoksa trend rallisi mi oluşturtacağını belirlemek için kritik öneme sahip. Yukarı hareketlerde 1,3360 ve 1,3400 bariyerleri de izlenmeli. Aşağı yönlü hareket halinde ise 1,3180 seviyesi destek olarak karşımıza çıkıyor. RSI göstergesi 66,71 seviyesinde bulunarak, pozitif bir görünüm sunuyor. Parite gün içerisinde %0,00'lik bir değişimle 1,3317 seviyesinden işlem görmekte. Bu veriler ışığında GBPUSD paritesinde kısa vadeli pozitif eğilim devam edebilir. Destek:1.3265 - 1.322 - 1.318 - Direnç:1.332 - 1.336 - 1.34 -