XAUUSD
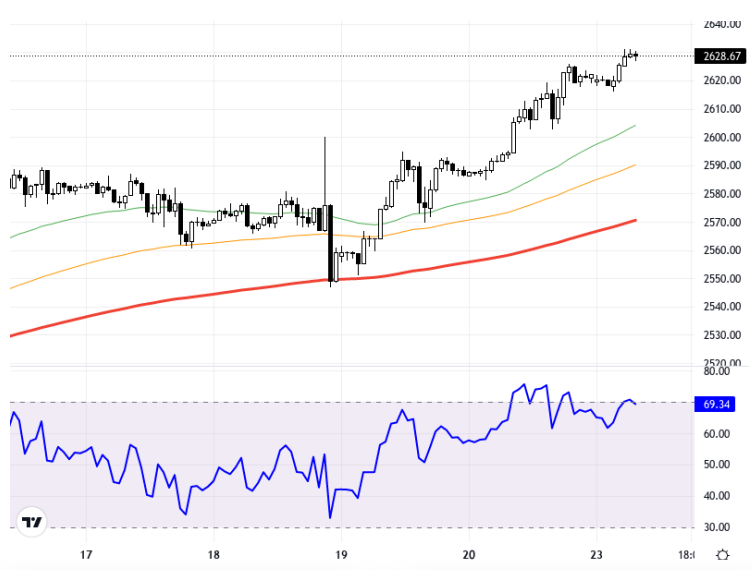
Gold is experiencing a strong positive trend as geopolitical tensions in the Middle East increase safe haven demand. The conflicts between Israel and Lebanon contribute to gold trading at high levels, while preliminary services and manufacturing PMI data to be announced during the day will be closely monitored by investors. Gold is trying to maintain its upward trend by holding within the 2600 – 2610 range, but unless it stays above this region and breaks above the 2630 level, new peak attempts may remain limited. According to the alternative scenario, closures below the mentioned support region could lead the price to move towards the 2580 levels. According to the chart analysis, XAU/USD is trading on an hourly timeframe. Priced at the current level of 2628.75, gold may view the 2630 and 2640 levels as resistance in its upward movement. In downward movements, the 2600 and 2590 levels will be followed as support. The RSI indicator is at the level of 69.48 and shows a positive trend, indicating that the price is approaching the overbought area. With a decrease of roughly 0.03% compared to the previous day, gold has the potential to continue its positive trend from these levels. Support:2620 - 2610 - 2600 - Resistance:2630 - 2640 - 2650-
Ons altın, Orta Doğu’da artan jeopolitik gerilimlerin güvenli liman talebini artırmasıyla güçlü pozitif bir seyir izliyor. İsrail ile Lübnan arasındaki çatışmalar ons altının yüksek seviyelerde işlem görmesine katkı sağlarken, gün içinde açıklanacak olan öncü hizmet ve imalat PMI verileri yatırımcılar tarafından yakından izlenecek. Altın, 2600 – 2610 aralığında tutunarak yukarı yönlü eğilimini korumaya çalışırken, bu bölgenin üstünde kalmadıkça 2630 seviyesi yukarı kırılmadıkça yeni zirve denemeleri sınırlı kalabilir. Alternatif senaryoya göre ise, belirtilen destek bölgesi altındaki kapanışlar, fiyatın 2580 seviyelerine yönelmesine yol açabilir. Grafik analizine göre, XAU/USD 1 saatlik zaman diliminde işlem görmekte. Mevcut 2628.75 seviyesinde fiyatlanan altın, yukarı yönlü hareketinde 2630 ve 2640 seviyelerini direnç olarak izleyebilir. Aşağı yönlü hareketlerde ise 2600 ve 2590 seviyeleri destek olarak takip edilecektir. RSI göstergesi 69.48 seviyesinde ve pozitif bir eğilim sergiliyor, bu da fiyatın aşırı alım bölgesine yaklaştığını gösteriyor. Bir önceki güne göre yaklaşık %0.03’lük bir düşüş yaşayan ons altın, bu seviyelerden pozitif eğilimini devam ettirme potansiyeline sahip olabilir. Destek:2620 - 2610 - 2600 - Direnç:2630 - 2640 - 2650 -