NDXUSD
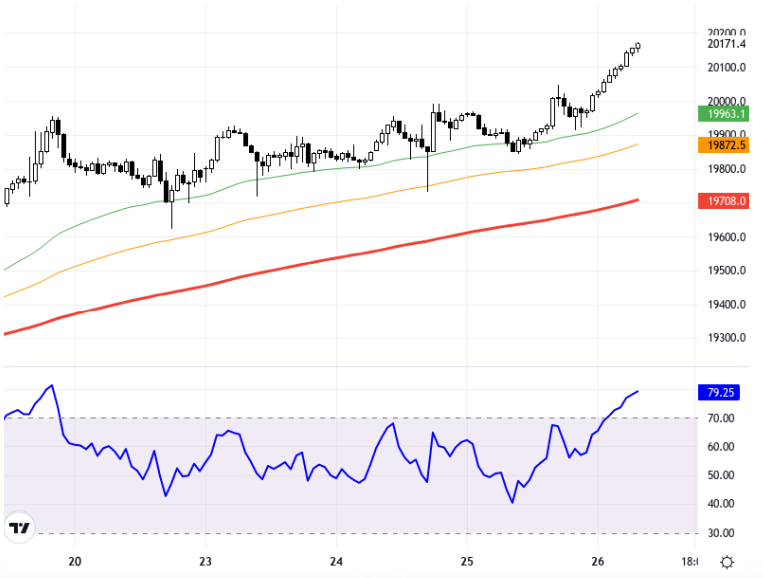
The NASDAQ100 index continues to show a positive trend ahead of growth rates and Fed Chair Powell's speech. The strong performance of semiconductor stocks such as Nvidia, AMD, and Intel contributes to the index outperforming other market components. The impact of economic indicators and central bank policies on the index is being monitored closely. In particular, the growth rate, durable goods orders, and unemployment claims to be announced in the US may be decisive factors in market pricing. In such an environment, as long as the NASDAQ100 index stays above the 20150 – 20250 region, the positive trend may continue. Technically, the NASDAQ100 index is moving between the 20150 – 20250 levels on the hourly chart. Above these regions, resistance levels of 20500 and 20650 may come into focus. On the downside, if the 20150 – 20250 range is broken, the 20000 and 19900 levels may serve as support. The RSI indicator is at 79.33, indicating overbought territory, which shows that the upward trend remains strong. The index is at 20174.9, a decrease of 0.08% compared to the previous day. It is important to follow these technical levels in the coming hours. Support:20250 - 20150 - 20000 Resistance:20500 - 20650 - 20750 -
NASDAQ100 endeksi, büyüme oranları ve Fed Başkanı Powell’ın konuşması öncesinde olumlu bir seyir izlemeye devam ediyor. Çip üreticileri; Nvidia, AMD ve Intel gibi hisselerin güçlü performansı, endeksin diğer piyasa bileşenlerinden daha iyi bir performans göstermesine katkıda bulunuyor. Ekonomik göstergelerin ve merkez bankası politikalarının endeks üzerindeki etkisi dikkatle izleniyor. Özellikle, ABD’de açıklanacak büyüme oranı, dayanıklı mal siparişleri ve işsizlik haklarından yararlanma başvuruları, piyasa fiyatlamalarında belirleyici unsurlar olabilir. Böyle bir ortamda, NASDAQ100 endeksi 20150 – 20250 bölgesi üzerinde kaldığı sürece, pozitif eğilim sürdürülmeye devam edebilir. Teknik olarak, NASDAQ100 endeksinin saatlik grafiğinde 20150 – 20250 seviyeleri arasında hareket sürüyor. Bu bölgelerin üzerinde, 20500 ve 20650 direnç seviyeleri gündeme gelebilir. Aşağı yönde ise, 20150 – 20250 aralığının kırılması durumunda, 20000 ve 19900 seviyeleri destek oluşturabilir. RSI göstergesi 79.33 seviyesinde yer alıyor ve aşırı alım bölgesine işaret ediyor, bu da yükseliş eğiliminin gücünü koruduğunu gösteriyor. Endeks, önceki güne göre %0.08 düşüşle 20174.9 seviyesinde bulunuyor. İlerleyen saatlerde, bu teknik seviyelerin takip edilmesi önemlidir. Destek:20250 - 20150 - 20000 - Direnç:20500 - 20650 - 20750 -