USDTRY
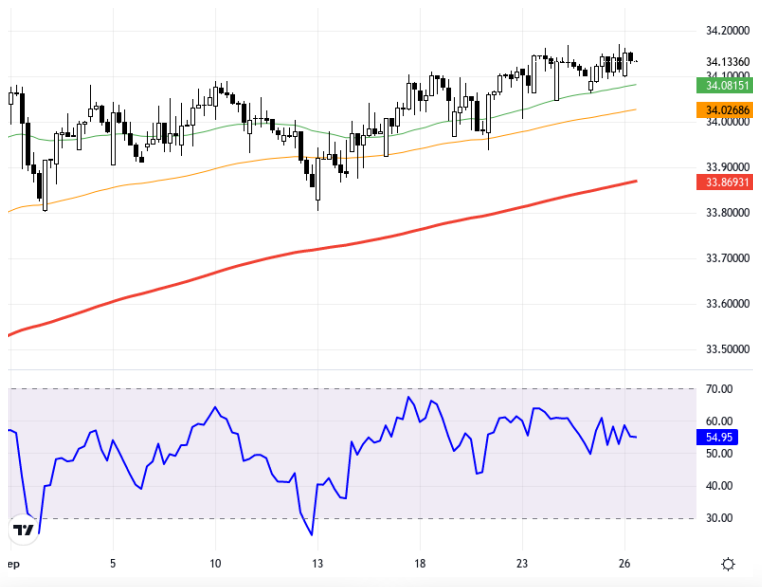
The USD/TRY pair stands out in a context where currencies of developing countries worldwide show varying performances against the US Dollar. Currently, the Turkish Lira is showing a weakness of 0.04%, placing it at the lower ranks of the list. Global economic developments and the reflections of relationships between the US and Turkey cause significant fluctuations in the Turkish Lira. In particular, US economic indicators and the Fed's monetary policies are among the main factors affecting the value of the TL. Measures from China to support the economy and the general trend of global markets also shape the effects on the TL. According to the technical analysis, the USD/TRY pair is tracked at the 33.96 level as an important support on the 4-hour chart. The pair is currently trading close to the 34.15 level, and persistence above this level may support the continuation of the upward movement. Resistance levels to be observed in upward movements can be determined as 34.17, 34.25, and 34.31. The RSI indicator is at the 54.95 level, indicating a neutral trend. Price movements in the pair may reach the next resistance levels or test the current support. The current price is 34.1325, showing a 0.08% change compared to the previous day. Support:34.09 - 34.02 - 33.96 - Resistance:34.17 - 34.25 - 34.31 -
USD/TRY paritesi, dünya genelinde gelişmekte olan ülkelerin para birimlerinin ABD Doları karşısında farklı performanslar sergilediği bir ortamda öne çıkıyor. Türk Lirası, şu an itibarıyla yüzde 0,04'lük bir zayıflık göstererek listenin alt sıralarında yer alıyor. Küresel ölçekte ekonomik gelişmeler ve ABD ile Türkiye arasındaki ilişkilerin yansımaları Türk Lirası'nın üzerinde önemli dalgalanmalara yol açıyor. Özellikle ABD'nin ekonomik göstergeleri ve Fed'in para politikaları, TL'nin değerini etkileyen başlıca unsurlar arasında bulunuyor. Çin'den gelen ekonomiyi destekleyici önlemler ve küresel piyasaların genel eğilimi de TL üzerindeki etkileri şekillendiriyor. Teknik analize göre USD/TRY paritesi 4 saatlik grafikte, 33,96 seviyesi önemli bir destek olarak izleniyor. Parite mevcut durumda 34,15 seviyesine yakın işlem görüyor ve bu seviye üzerindeki kalıcılıklar yukarı yönlü hareketin devamını destekleyebilir. Yukarı yönlü hareketlerde izlenecek direnç seviyeleri 34,17, 34,25 ve 34,31 olarak belirlenebilir. RSI göstergesi 54,95 seviyesinde olup, nötr bir seyir izliyor. Paritede fiyat hareketleri sonraki direnç seviyelerine ulaşabilir ya da mevcut desteği test edebilir. Mevcut fiyat 34,1325 olup, bir önceki güne göre yüzde 0,08’lik bir değişim göstermiştir. Destek:34.09 - 34.02 - 33.96 - Direnç:34.17 - 34.25 - 34.31 -