BRNUSD
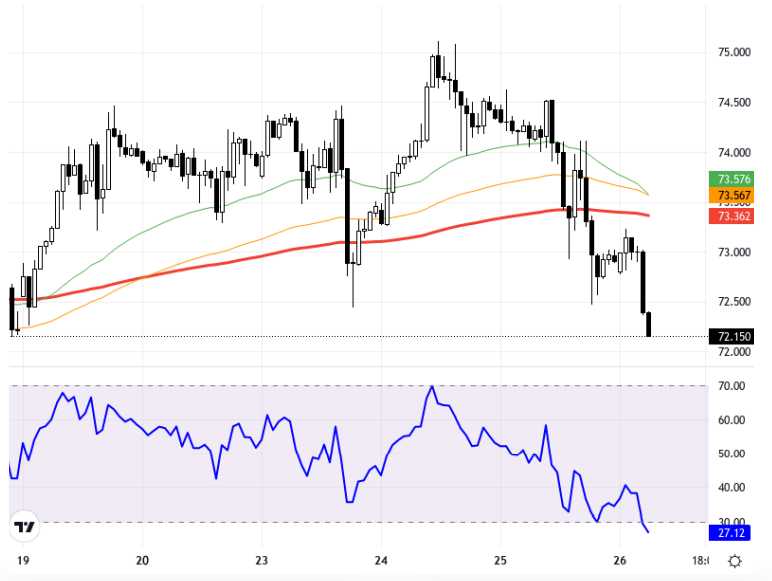
Brent crude prices are declining due to increased expectations that political developments in Libya will normalize oil production shortly, combined with the recovery of the dollar. Even the U.S. Energy Information Administration's announcement of a 4.5 million barrel decrease in inventories couldn't prevent this fall. Movements in European and U.S. stock markets and U.S. growth data might influence pricing. Resistance levels for Brent crude are at 73.50 - 74.00, and as long as it remains below these levels, downward pressures are expected to continue. In the event of a possible recovery, closures above 74.00 may bring new targets into focus. According to the technical analysis, a 1-hour time frame was used on the chart. Currently, Brent crude prices are trading in a range where 72.50 and 72.00 levels can be seen as support. Prices may test lower levels before returning to the 74.00 level. The RSI indicator is currently at 27.40, indicating entry into the oversold zone and displaying a negative outlook. There has been a 0.29% decrease compared to the previous day, with the current price at 72.179 Support:72.5 - 72 - 71.5 - Resistance:73.5 - 74 - 74.5 -
Brent petrol fiyatları, Libya'daki siyasi gelişmelerin petrol üretiminin kısa sürede normale döneceği beklentisini artırması ve dolardaki toparlanmanın etkisiyle geriliyor. ABD Enerji Bilgi Dairesi'nin stoklarda 4,5 milyon varil azaldığını açıklaması bile bu düşüşe engel olamadı. Avrupa ve ABD borsalarının hareketleri ile ABD büyüme verileri fiyatlamalar üzerinde etkili olabilir. Brent petrolün önündeki direnç seviyeleri 73,50 - 74,00 olup bu seviyelerin altında kaldığı sürece aşağı yönlü baskıların devam edebileceği düşünülüyor. Olası toparlanmada ise 74,00 üzerindeki kapanışlar yeni hedefleri gündeme getirebilir. Teknik analize göre grafikte, 1 saatlik zaman dilimi kullanılmış. Mevcut durumda, Brent petrol fiyatları 72,50 ve 72,00 seviyelerinin destek olarak izlenebileceği bir aralıkta işlem görüyor. Fiyatlar 74,00 seviyesine geri dönmeden önce daha düşük seviyeleri test edebilir. RSI göstergesi şu anda 27,40 seviyesinde olup aşırı satım bölgesine girildiğini ve negatif bir görünüm sergilediğini gösteriyor. Önceki güne göre %0,29'luk bir düşüş yaşanmış durumda ve güncel fiyat 72,179 seviyesinde bulunuyor. Destek:72.5 - 72 - 71.5 - Direnç:73.5 - 74 - 74.5 -